

Beacon Economics - World Economic Report, June 2013
This month, AfricasheW320 features the 2nd world economic report from Beacon Economics. Chris Thornberg, founder of Beacon Economics, was the keynote speaker at the 2012 ACA Conference in Benin, where he discussed cashew in a global economic setting.
In the June analysis below, Beacon explains lagging economic growth in Africa, the resilience of the US economy, and the expansion of the agriculture industry in early 2013.
Leading economic indicators suggest that Africa, like much of the rest of the world, continues to struggle with slowing economic growth.
· According to the International Monetary Fund’s (IMF) World Economic Outlook, released in April 2012, estimates show Sub-Saharan Africa GDP grew by 4.8% over 2011 levels. While this is a strong pace of growth, it is slower than the 2011 growth rate of 5.3% and reflects today’s sluggish global economy.
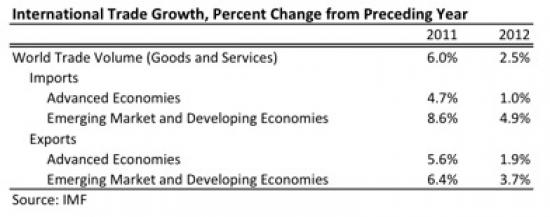
· The global economy overall poses one of the largest impediments for growth in the region, particularly for economies heavily dependent on exports. Total world imports grew 2.4% in 2012 according to the IMF, slower than the 6% export growth seen the year before. Further declines in overall world demand could result in another year of declining GDP growth for Sub-Saharan Africa.
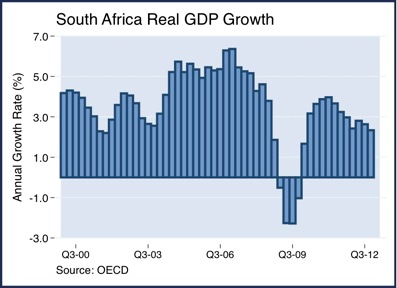
·South Africa, the continent’s largest economy, experienced real GDP growth in 2012 that, while positive, also slowed noticeably from 2011. For the year ending 2012, South African GDP grew 2.6%, down from 3.5% annual real growth in 2011.
· The slowdown in South Africa’s GDP growth can be attributed in part to a lack of skilled labor. Even as the government’s finances improve, the skills mismatch in the labor force will constrain GDP growth as potential output is left unrealized.
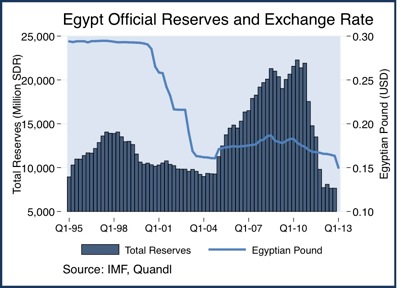
· Egypt, the second largest economy in Africa, appears poised to constrain continent-wide growth in 2013. Since the toppling of President Hosni Mubarak more than two years ago, Egypt’s foreign currency reserves have seen large decreases as a result of government food subsidy programs. Egypt’s total reserves fell 22% in 2012 according to the International Monetary Fund. This is in addition to a 55% decline in 2011. In January 2013 Egypt’s reserves fell another 12% from December 2012 levels.
· The depreciation of the Egyptian Pound has greatly exacerbated the nation’s problems through food import prices. As the pound falls against the U.S. dollar the price of imports may stay the same in terms of dollars, but in local currency, prices are increasing. The month of April marks the pound’s lowest point against the dollar in decades.
Slow economic growth remains the name of the game in the international arena. China’s current leading indicators suggest weakness, but may be close to turning the corner. The U.S. economy appears to be the most resilient of the major industrialized nations.
· New estimates by the IMF indicate global GDP growth slowed by 0.8% compared to 2011, falling to 3.2% in 2012. Emerging markets and developing economies are posting respectable growth rates while industrialized nations, dragged down by the Euro Area’s financial troubles, continue to struggle.
· The slowdown in world output is readily evident in the 2012 international trade statistics. The net volume of goods and services traded grew by 2.5% in 2012, down from 6% growth in 2011. Emerging markets and developing economies saw less deceleration in annual growth than industrialized nations for total imports and exports.
· At the end of 2012, Chinese real GDP growth accelerated slightly, raising hope for a turnaround after seven consecutive quarters of decelerating growth. However, in the first quarter of 2013, Chinese real GDP grew 7.7% over the same quarter of last year, down marginally from 7.8% annual growth in the fourth quarter of 2012. Still, the downward trend in China’s GDP growth over the last few years could finally be bottoming out and may be ready to stage a recovery.
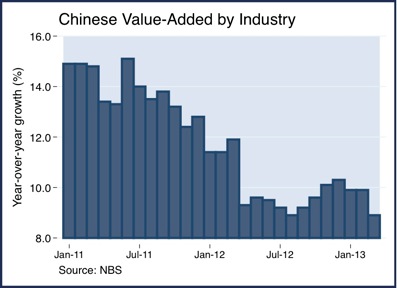
·In March 2013, Chinese value added by industry edged down to 8.9%, from 9.9% in February. Over the last few years China has not been able to maintain its past double-digit growth rates and recent data shows the downward trend is continuing. There are signs that the bottom may be hit in the near future before recovery begins.
· Japanese GDP growth saw a small surge in the first quarter of 2013, increasing by an annualized 3.6% versus 2.4% for the U.S. economy. This surge in economic output was due primarily to a rising stock market in response to the Bank of Japan’s monetary policies, which has increased domestic consumption, as well as exports boosted by a weaker yen.
· In an attempt to stimulate the Japanese economy after decades of deflation, the Bank of Japan is stepping up long-term bond purchases and lifting the average maturity of its holding from three to seven years. Their plan is to double the Japanese monetary base over a 21 month period. How the Japanese monetary policy plays out in the long run is uncertain. A devalued currency can stimulate export growth and boost company profits, but runs the risk of setting off a currency war if the weaker yen is seen to give the Japanese an unfair advantage in global trade.
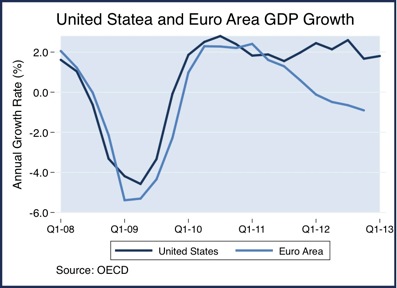 · While the Euro Area economy contracted each quarter in 2012 on a year-over-year basis, the U.S. economy showed greater resiliency. The United States has not seen a single quarter of negative year-over-year growth since the fourth quarter of 2009. Moreover, the U.S. economy appears to have picked up speed in the first quarter of 2013, growing by 1.8%, a slight acceleration over the 1.7% year-over-year growth in the fourth quarter of 2012.
· Given that the combined economies of the United States and the Euro Area made up 44.3% of world output in 2011, the fates of these economies weigh heavily on overall economic performance across the globe.
· One advantage the U.S. economy has is its own domestic consumer market. U.S. GDP is roughly 70% consumption based, and U.S. retail sales have remained strong since bottoming out in March 2009. As of April 2013, U.S. retail sales, excluding automobiles, were up 9.1% year-to-date compared to the first four months of 2011.
· On a comparative basis, the Euro Area’s retail trade volumes were down 2% in the first quarter of 2013 compared to one year before. China’s total retail sales fared much better in the first quarter of 2013 with a 13% increase in total retail sales. And while China’s rate of growth is greater than that of the U.S., it is important to remember that their retail base is still developing and not as large, therefore it is prone to higher rates of growth than in an industrialized nation.
Agriculture trade flows between the U.S., China, and the rest of the world during the first two months of 2013 indicate that the Agriculture industry has continued to expand following last year’s recovery.
· Total export and import agricultural trade flows between the U.S., China, and the rest of the word increased by 5.8% in the first two months of 2013 over the same year-to-date period in 2012. While this is lower than the 9.3% real trade growth for all of 2012, it only represents the first two months of the year and trade flows can fluctuate from month to month for a variety of factors.
· The bulk of the increase in trade flows stems from Chinese exports, and primarily from edible meat, fish, and crustaceans, which increased 22% in the first two months of 2013 compared to the same period in 2012.
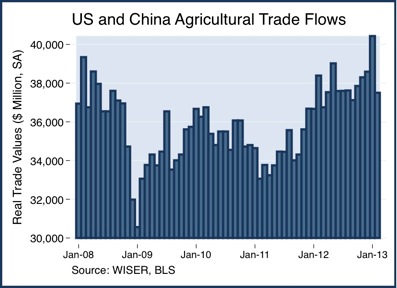
· Comparing the most recent three months of trade flows with the preceding three months on a seasonally adjusted basis can help remove some of the month-to-month variation. This analysis shows that agricultural trade flows from December 2012 through February 2013 grew by 2.9% over the previous three months (trade flows grew by 0.4% from September 2012 through November 2012), after adjusting for inflation. This indicates a healthy agriculture trade industry—especially in light of slowing economic growth rates worldwide.